Association of Medical Research Visual Abstract Display With Social Media–Driven Site Traffic
Abstract
N. Seth Trueger,1,2 Eman Aly,3 Sebastien Haneuse,2,4 Evelyn Huang,1 Michael Berkwits3
Objective
Medical journals often use visual abstracts (VAs), “infographics” designed to graphically convey a study’s research question, methods, findings, and conclusions, to summarize and promote published research on social media. Studies suggest that VAs increase an article’s reach and engagement, mostly demonstrated for individual journals on Twitter.1-3 The JAMA Network, a family of 2 general medical and 11 specialty journals, began creating VAs for randomized clinical trials (RCTs) in 2018-2020 and publishing them online and in social media. This study examined the association of VAs with social media–driven site traffic and metrics.
Design
This random-sequence simultaneous crossover trial included all RCTs published in the 13 JAMA Network journals with an accompanying VA between September 21, 2021, and May 15, 2022. For each, tweets and Facebook posts promoting the RCT were published including a standard text summary with a link to the online article, accompanied by 3 image display types: (1) preview VA, a VA thumbnail that linked to the article when clicked; (2) expandable VA, a VA thumbnail that expanded to full screen when clicked; and (3) article image, an article figure or table thumbnail that linked to the article (Facebook) or expanded to full screen (Twitter) when clicked (control display). Three tweets and 3 Facebook posts, 1 with each image display type, were published to Twitter and Facebook nearly simultaneously (1 minute apart) in random sequence within an hour of article publication. The primary outcome was the number of link clicks by image display type at 1 week. Secondary outcomes were social media Twitter impressions/Facebook reach (how many times people saw the tweet or post) and engagement (sum total number of comments/replies, shares by other users, and likes) by image display type at 1 week. The study was designed to provide 80% power to detect a 50% increase in median link clicks comparing either of the 2 VA formats vs article image display.
Results
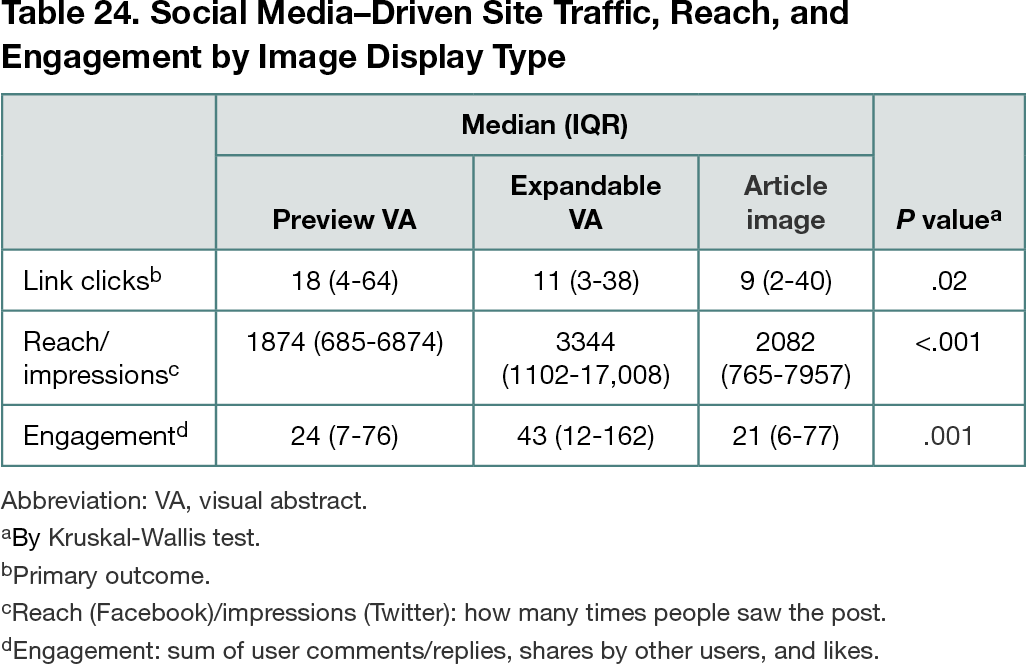
Among 205 JAMA Network RCTs with VAs, link clicks to full-text articles were higher with preview VAs vs article images; impressions/reach and engagement were higher with expandable VAs vs article image displays (Table 24). In a preplanned subgroup analysis, the higher link clicks appeared attributable to preview VA display on Twitter (preview VA median, 12 [IQR, 3-41] and expandable VA median, 6 [IQR, 2-21] vs article image median, 6 [IQR, 1-21]; P < .001) rather than Facebook (medians, 1 [IQR, 0-14] and 3 [IQR, 0-12] vs 1 [IQR, 0-13], respectively; P = .11).
Conclusions
In this random-sequence simultaneous crossover trial, the use of visual abstracts in social media posts was associated with higher social media–driven journal site traffic when displayed as preview links, and higher social media reach and engagement when displayed as expandable images, compared with article images.
References
1. Oska S, Lerma E, Topf J. A picture is worth a thousand views: a triple crossover trial of visual abstracts to examine their impact on research dissemination. J Med Internet Res. 2020;22(12):e22327. doi:10.2196/22327
2. Ibrahim AM, Lillemoe KD, Klingensmith ME, Dimick JB. Visual abstracts to disseminate research on social media: a prospective, case-control crossover study. Ann Surg. 2017;266(6):e46-e48. doi:10.1097/SLA.0000000000002277
3. Chisari E, Gouda Z, Abdelaal M, et al. A crossover randomized trial of visual abstracts versus plain-text tweets for disseminating orthopedics research. J Arthroplasty. 2021;36(8):3010-3014. doi:10.1016/j.arth.2021.04.006
1Department of Emergency Medicine, Northwestern University Feinberg School of Medicine, Chicago, IL, USA, ntrueger@gmail.com; 2JAMA Network Open, Chicago, IL, USA; 3JAMA Network, Chicago, IL, USA; 4Department of Biostatistics, Harvard T. H. Chan School of Public Health, Boston, MA, USA
Conflict of Interest Disclosures
N. Seth Trueger receives salary support from the American Medical Association (AMA) for his role as digital media editor, JAMA Network Open. Eman Aly and Michael Berkwits are full-time employees of the AMA and the JAMA Network. Sebastien Haneuse receives compensation from the AMA for his role as statistical editor, JAMA Network Open. Michael Berkwits is co-director of the Peer Review Congress but was not involved in the review or decision for this abstract.