Epidemiology of Scientific Output During the COVID-19 Pandemic
Abstract
Anne Yang,1,2Jacob Kendall-Taylor,3 Christopher C. Muth,3 Jason N. Kennedy,2,4 Stacy L. Christiansen,3Annette Flanagin,3Christopher W. Seymour2,3,4 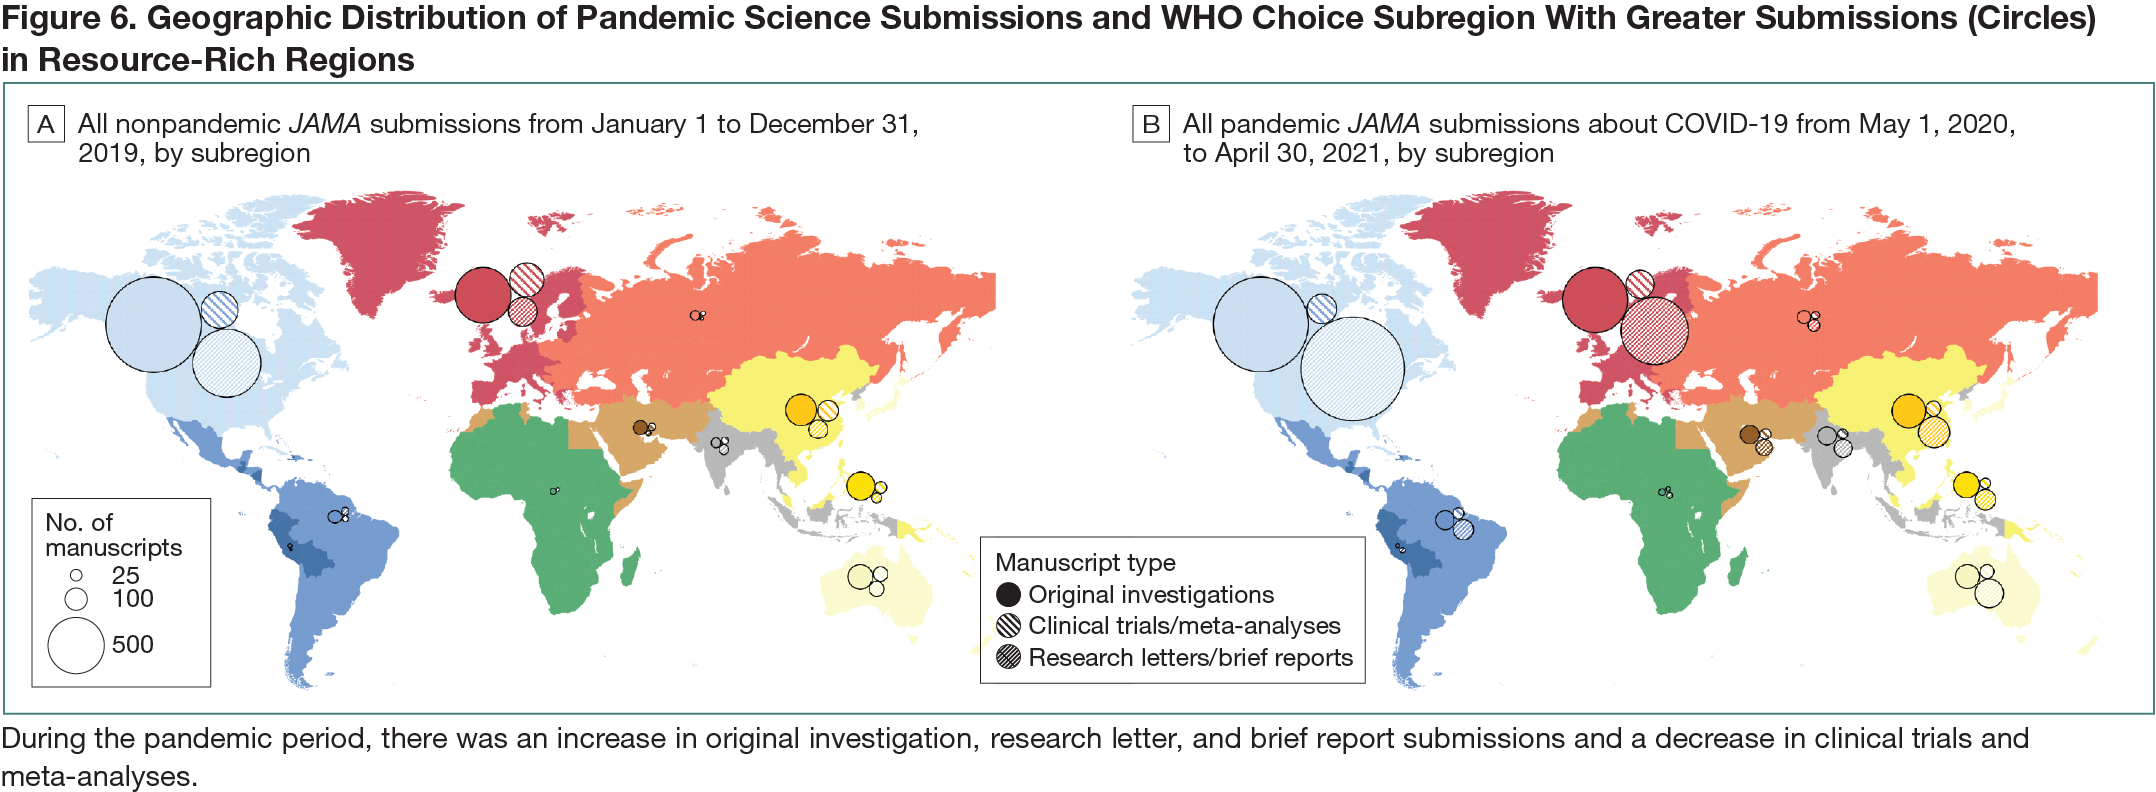
Objective
During the SARS-CoV-2 pandemic, clinicians, scientists, and public health experts raced to study the new disease, resulting in extraordinary scientific output. However, the relationship between pandemic scientific output and disease burden—particularly in characteristically underrepresented regions—is unknown.Design
This was a cohort study of research submissions to JAMA from May 1, 2020, to April 30, 2021, identified with a query “COVID-19” (n = 12,910) with a nonpandemic comparison cohort of all submissions to JAMA from January 1 to December 31, 2019 (n = 9912). The following article types were included as “pandemic science”: clinical trial, meta-analysis, original investigation (ie, other full-length research submissions excluding the previous 2 categories), research letter, and brief report. Data on COVID-19 infections and deaths were sourced from World Health Organization (WHO) situation reports and analyzed by epidemiologically defined WHO-CHOICE subregions (Africa, Americas, Middle East, Europe, South-East Asia, and Western Pacific with China as a separate region).1,2 WHO-CHOICE subregions are grouped A to E according to adult and child mortality, with subregion A having very low rates of adult and child mortality and subregion E having very high adult and child mortality.Results
In the pandemic cohort, the number of JAMA submissions reporting on COVID-19 were greater than the entirety of submissions in the nonpandemic cohort (12,910 vs 9912), particularly for original investigations (3449 vs 3152), research letters (2499 vs 823), and brief reports (1254 vs 495), respectively. However, this was not the case for submissions in the pandemic vs nonpandemic periods for clinical trials (317 vs 396) or meta-analyses (213 vs 311). In general, JAMA submissions tracked regionally with COVID-19 burden, with an increase in submissions several weeks after an increase in COVID-19 cases (Figure 6). When pandemic science was mapped according to WHO-CHOICE subregions, Americas A had the most submissions (4120), followed by Europe A (1944) and China (484). When measured as JAMA submissions per 1 million population, all subregions saw an increase during the pandemic period compared with the nonpandemic period, particularly in more developed subregions like Americas A (10.8 per 1 million in 2020 vs 8.1 per 1 million in 2019) and Europe A (4.3 per 1 million in 2020 vs 2.27 per 1 million in 2019).